In today’s competitive advertising landscape, understanding what your competitors are up to is important. That’s where AdClarity – Advertising Intelligence comes in.
This powerful competitive intelligence app allows you to spy on your competitors’ ads and gain valuable insights into their advertising strategies which will help you increase your CTR.
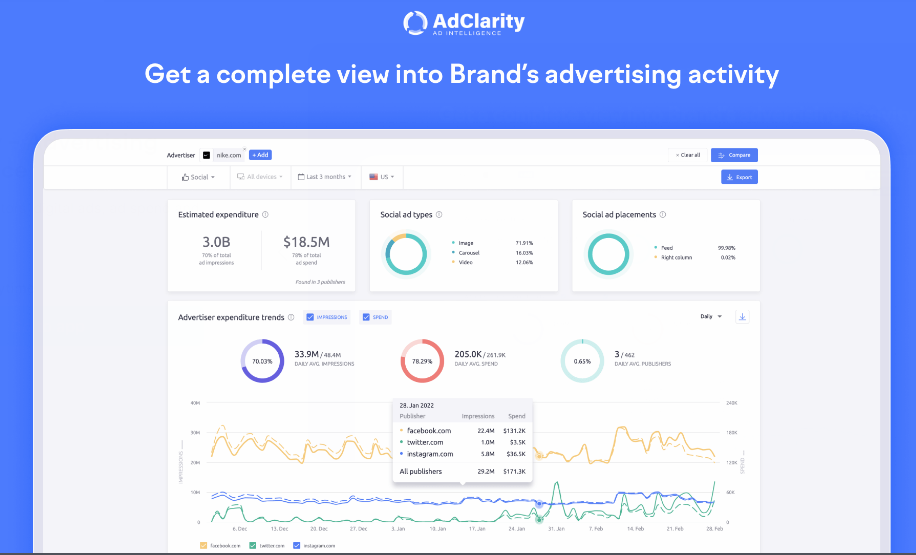
Let’s take a closer look at one of the most powerful apps in the Semrush app center and how it can help you unleash the potential of your ads.
What is AdClarity – Advertising Intelligence?
AdClarity is a competitive intelligence app in SEMrush’s app center that helps you find and analyze your competitors’ display, video, and social ads across thousands of publishers from over 50 global markets.
Why understanding competitors’ ads is important?
By understanding competitors’ ads, you can gain insights into their strategies, target audience, pricing, and more. These insights can help you to be more competitive and develop smarter marketing strategies.
AdClarity – Advertising Intelligence Key features
- Competitive analysis: Gain a comprehensive understanding of your competitor’s digital advertising campaigns.
- Performance optimization: Identify the publishers, advertisers, and ad networks that are delivering the best results and adjust your strategy accordingly.
- Ad comparison: Analyze and compare your ads to those of your competitors to gain a better understanding of what works and what doesn’t. This will help you craft more effective ad copy and improve your overall advertising performance.
- Market research: Use AdClarity to gather data on the broader advertising landscape, including emerging trends, new opportunities, and potential threats. This can help you stay ahead of the curve and make informed decisions about your advertising strategy.
AdClarity – Advertising Intelligence Pricing
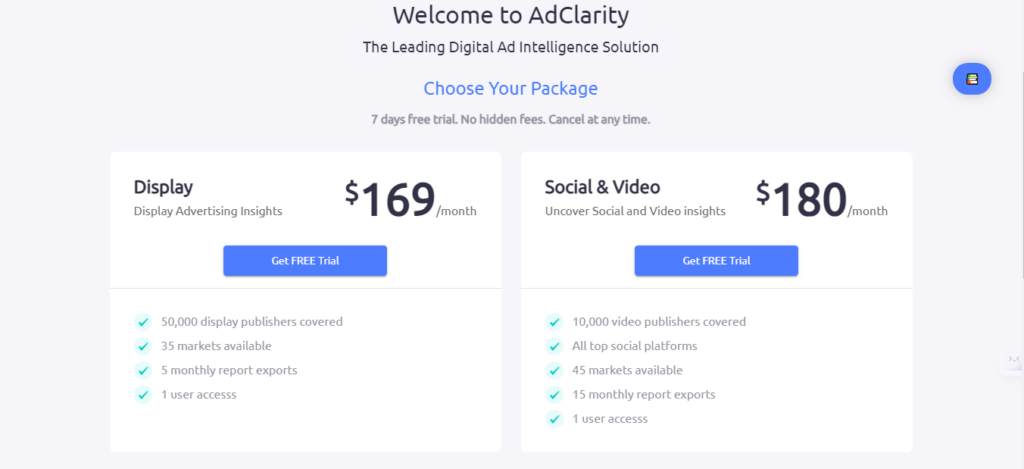
As you can see in the image above AdClarity app has 2 package options to choose from:
- AdClarity display: $169/month includes coverage of 50k display publishers, availability in 35 markets, and 5 monthly report exports.
- AdClarity Social & Video: $180/month includes coverage of 10,000 video publishers, 45 markets, all social platforms, and 15 monthly report exports.
In addition, it offers a 7-day free trial to try out the (Display plus social & video) packages before making a purchase, and if you are not satisfied you can cancel it at any time.
How to use the AdClarity – Advertising Intelligence App
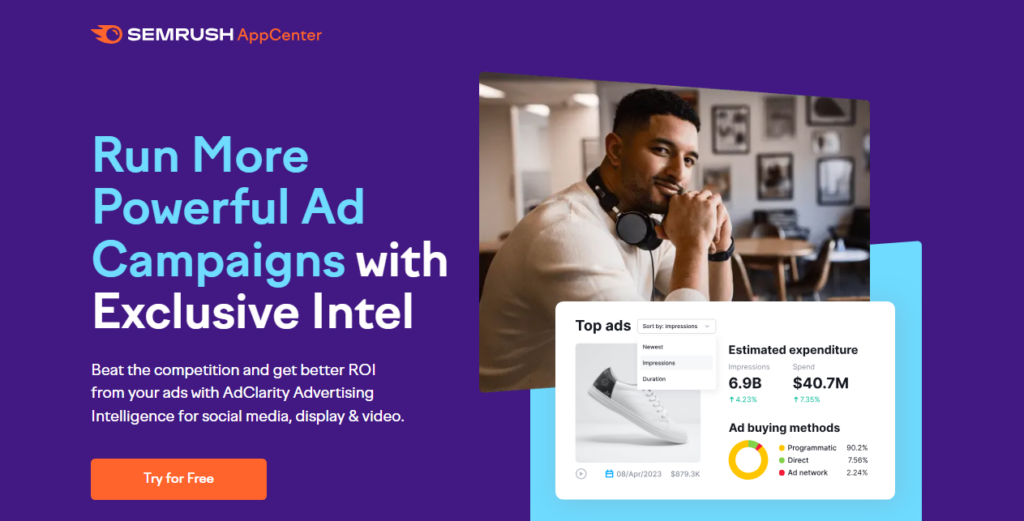
To start using AdClarity, simply follow this link to sign up. Click on the “Try For free” button to begin a 7-day free trial of the plan you have chosen.
After that, You will be redirected to the Semrush sign-in page.
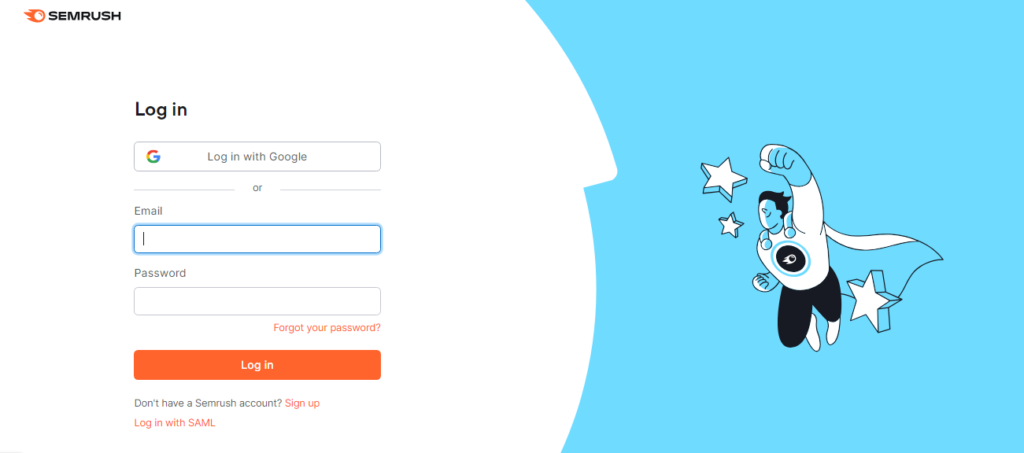
If you don’t have a Semrush account, you can create a free account with daily limits or start a 7-day free trial to access all premium features.
After registering or signing in, you will be directed to this page to enter your payment information and start your free trial.
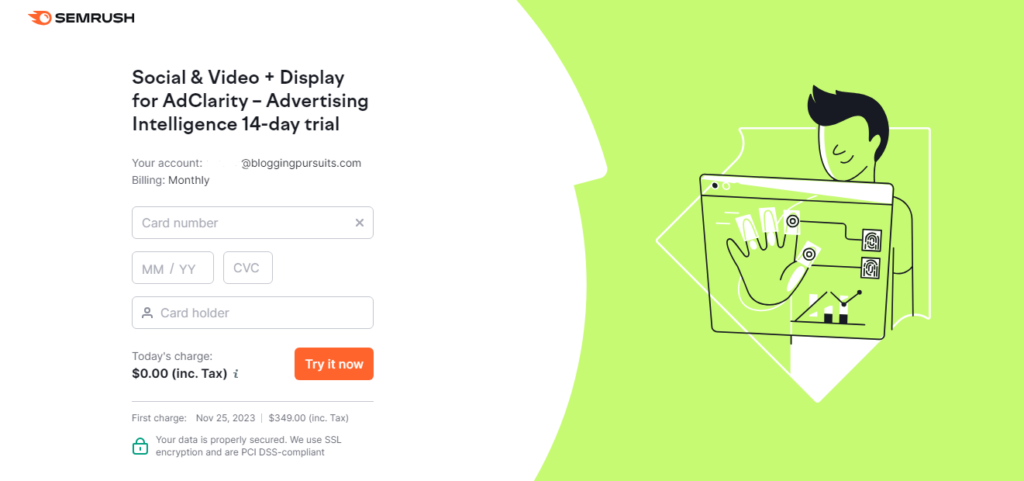
If you already have a Semrush account, you can access AdClarity by following these steps:
Go to the top menu and select “App Center“, then choose “Store“. Search for “AdClarity – Advertising Intelligence” and click on “Get Free Trial“. You will be redirected to complete your payment information and start your free trial.
In the AdClarity app, you will see the user interface, as shown here. It includes a search bar that allows you to search using different terms such as Advertisers, Publishers, Keywords, Campaigns, Groups, and Comparisons.

- Keywords: To search for keywords, simply enter the keywords you want to find related ads for.
- Campaigns: Enter the name of the campaign.
- Publisher: Enter publisher domain name without WWW.
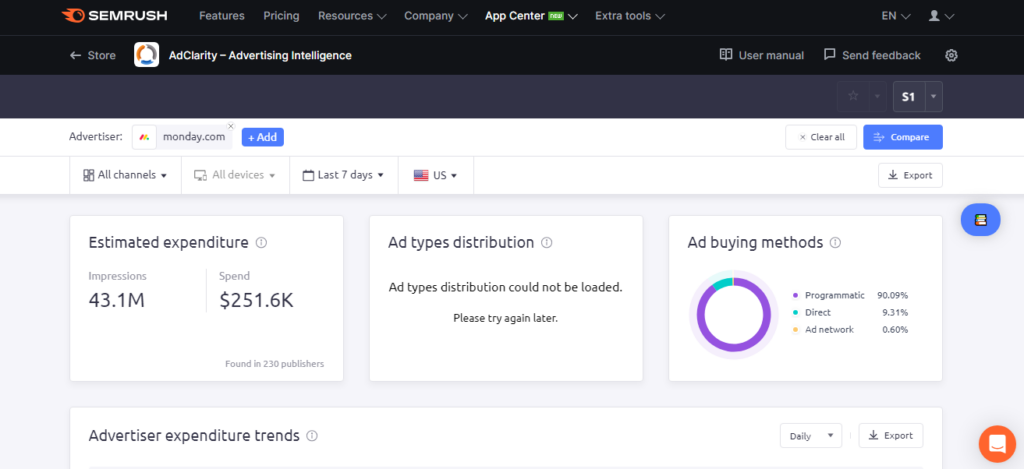
- Advertisers: To use the app and analyze competitor’s data you will need to add the domain that you want to analyze click on “add” and write the domain name without www like monday.com. as shown in the image below, then select the search results that match.
Groups & Comparisons
If you would like to analyze more than one domain there are two solutions :
- Create a Group to view the integrated data of domains.
- Compare up to 10 selected domains or one group with another.
To create a group, as in the previous step just click on “add” and select each domain you want to include. And if you want to create a comparison, click on ”Compare” and then choose the domains.
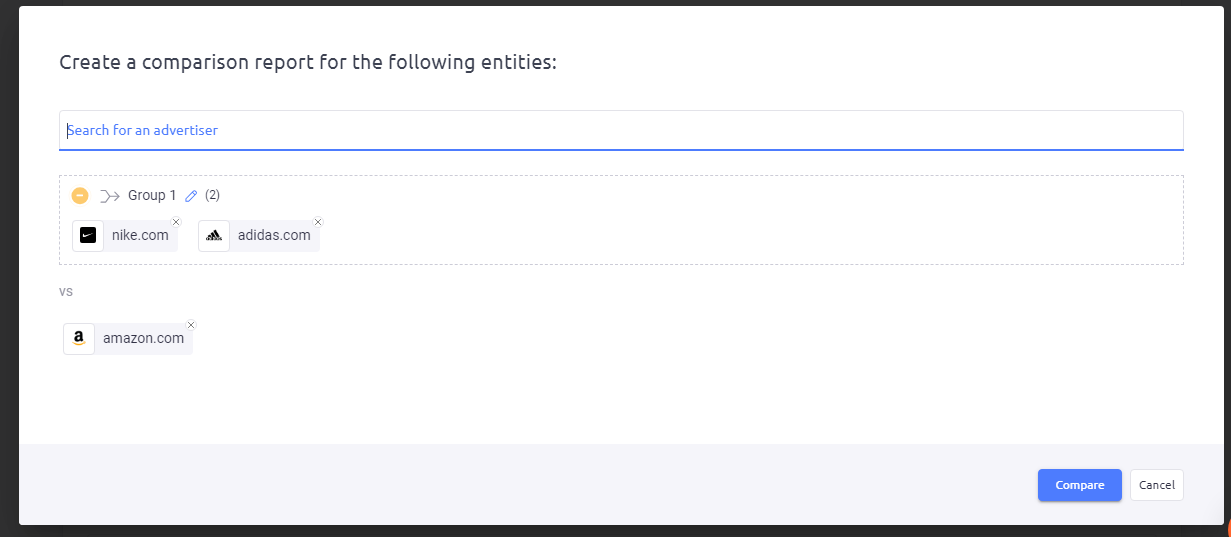
If you want to compare click on ” Rearrange” in case you want to edit them.
This refers to creating a comparison report, where you can add additional domains or rearrange them by using drag-and-drop.
To save the created comparison, click on “Save” and give it a name.
Let’s Move on to the second row of the header menu, where you can customize your view by selecting your preferred channel, devices, period, and country being analyzed:
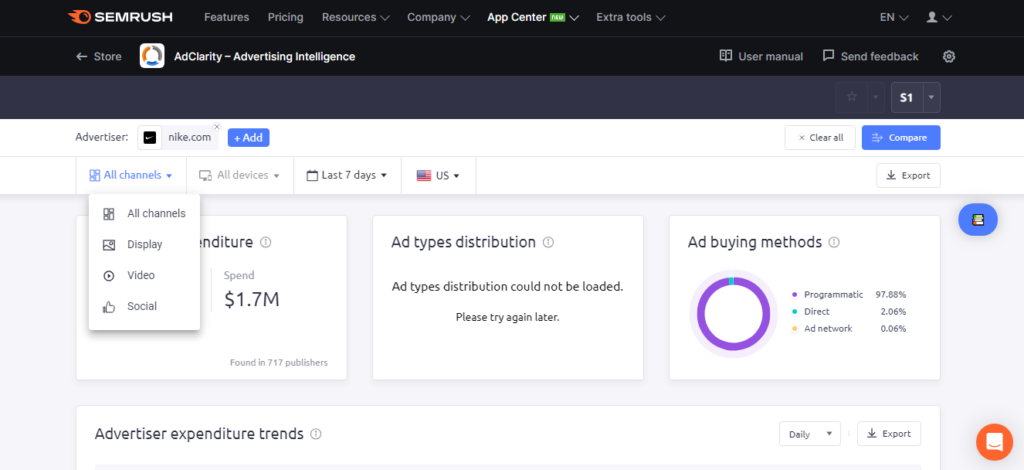
The advertising channels include social media, video, display, and all other available channels. You can choose to target desktop, mobile, or all devices for your advertisements.
When you wish to change the currency that is displayed in cost estimations, please click on the user name in the top right corner Then click “User settings” and select a default currency from the list.
To export your report in AdClarity, you can easily do so by following these steps.
Firstly, locate the “Export” button on the right side of the header, which can be found in the second row. Click on this button to proceed. Once clicked, a menu will appear allowing you to select the desired file type for exporting.
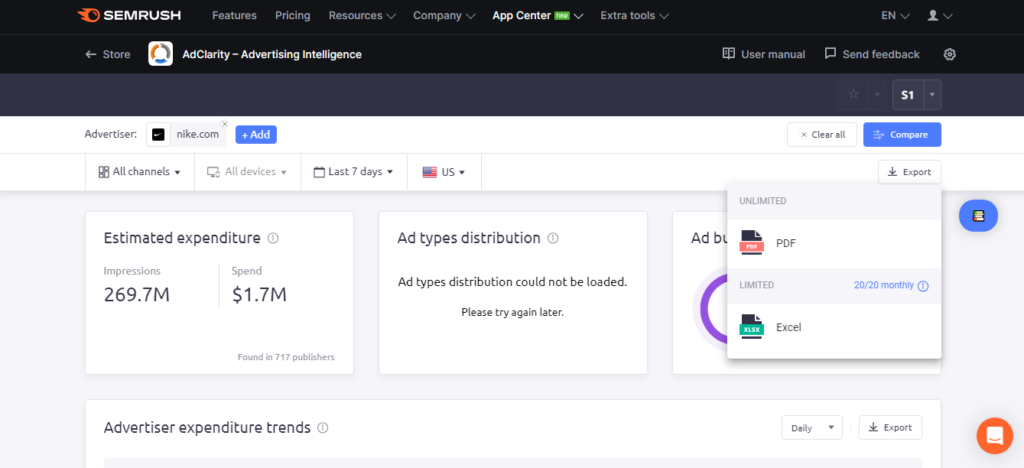
If you choose the PDF option, it will export all the charts and graphs exactly as they are displayed within the AdClarity application.
On the other hand, if you opt for the Excel format, it will generate a spreadsheet containing the data presented in the report.
It’s important to note that the number of Excel reports you can export per month depends on your subscription plan. If you have an AdClarity subscription that includes only the display channel, you can export up to five Excel reports monthly.
The report types
AdClarity’s Advertising Intelligence platform provides users with a range of report types to gain valuable insights into their advertising efforts.

These report types include Publisher reports, Advertiser reports, Campaign reports, and Keyword reports.
Each report offers a unique perspective by analyzing different sets of data. However, what makes these reports even more powerful is the ability to compare publishers and advertisers against each other.
By leveraging this feature, users can obtain a comprehensive overview and make informed decisions based on the performance of different entities within their advertising campaigns.
Types of widgets
Let me quickly walk you through the various widgets available in AdClarity – Advertising Intelligence app and what its rules are.

Estimated Expenditure:
- Shows total impressions and ad spend across all publishers
- The number of publishers contributing to estimates can be found in the widget
Ad Placement:
- Analyzes where ads were placed on the screen or in a video Shows options for Above the fold,
- Below the fold, Far below the fold, Pre-roll, Mid-roll, Post-roll, and Masthead
Ad Buying Methods:
- Shows a high-level overview of ad-buying methods
- Broken down into Ad Network, Programmatic, and Direct
Estimated Impressions:
- Compares the trend of impressions generated by each advertiser
- Color-coded line graph
Top Ads:
- Displays the top-performing ads from selected domains
- Can be sorted by newest, total impressions, and duration seen
Comparison Mode:
- The second column of the report shows the relevant publisher or advertiser being compared.
- Data included in this chart are Impressions, Share of Voice (SoV), Ad spending, Number of publishers (for a single domain in Advertiser Overview only), and advertisers (for that specific campaign, in Publisher Overview).
Top Publishers & Top Advertisers:
- The Top Publishers and Top Advertisers widgets rank the best-performing publishers and advertisers by impressions.
- Top Publishers: visible when analyzing an advertiser domain (also called Top Publisher & Apps when viewing all channels).
- Top Advertisers: visible when analyzing a publisher domain.
- On the left side of the widget, the top five publisher domains and apps, or the top advertisers, are listed.
- In the center, you’ll find a breakdown of ad-buying methods used for each.
- On the right, a pie chart displays the share of voice owned by each of the top five domains, compared to all others.
- To view the complete list of top publishers or advertisers, click on the “View all” link at the bottom of the widget.
- A new window will open with the detailed report.
Youtube Channels:
- The Youtube Channels widget shows the top channels where the advertiser has placed ads.
- This widget appears when analyzing a single advertiser domain on the video channel.
- The chart includes the top five channels, the number of campaigns, the number and share of impressions, the value and share of advertising spend, and the share of voice breakdown.
- Click the “view all” link at the bottom to see a complete list of YouTube channels where the advertiser’s ads were seen.
Social Networks:
- The Social Networks widget appears when you analyze a single advertiser domain on the social channel.
- It shows you the social platforms where the advertiser’s ads have appeared (including Facebook, Instagram, Twitter, and TikTok), the number and share of impressions received, ad buying methods, value and share of advertising spend, and share of voice.
- Use the drop-down menu on the right to customize how the values in the Impressions and Spend columns appear.
Top Apps:
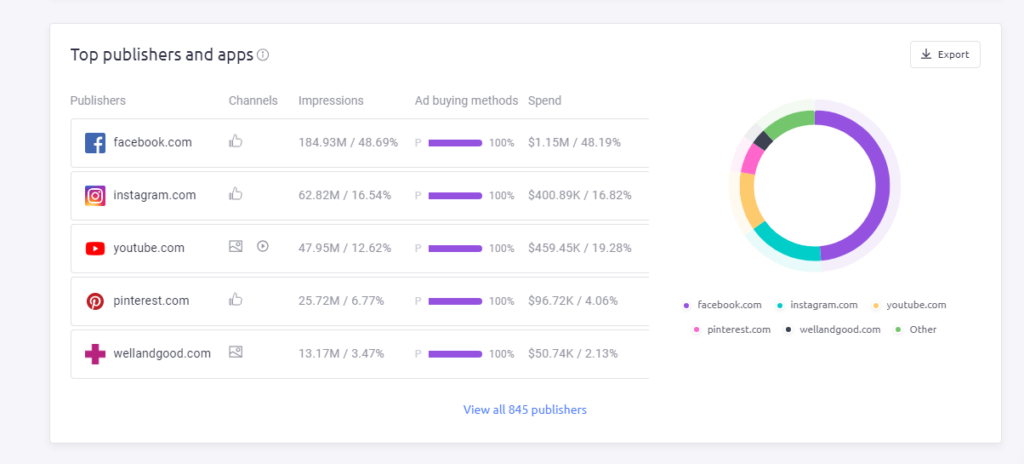
- The Top Apps widget appears when you analyze mobile data for a single advertiser domain or group.
- It ranks the best-performing publisher apps by ad impressions.
- On the left side of the app, a chart breaks down the top 5 publisher apps by Impressions, Share of Voice, Spend, and Mobile OS (e.g. Apple vs Android).
- On the right, a pie chart displays the share of voice for the top 5 apps compared to all others.
- To view a complete list of apps included in this report, click the “View all apps” link at the bottom of the widget.
Ad Buying Methods (Full):
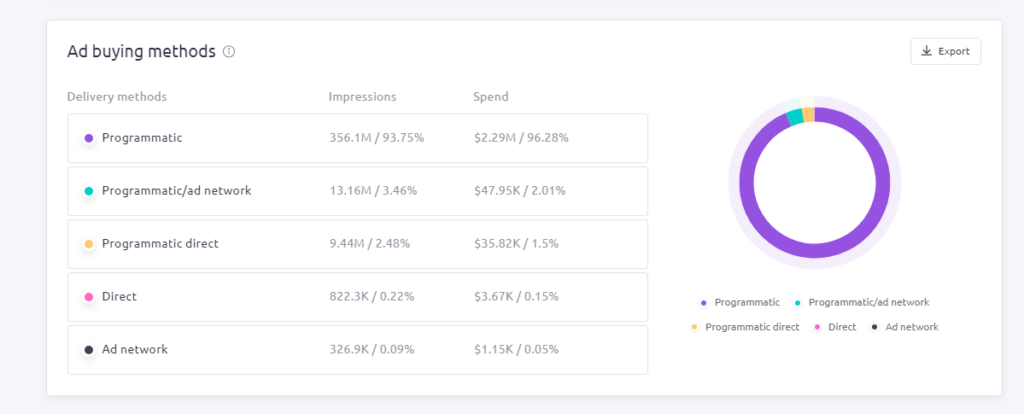
- The second Ad Buying Methods widget shows a more detailed breakdown of the methods used by advertisers to buy ads displayed by publishers.
- This widget includes five different ad buying methods: Ad Network, Programmatic, Direct, Programmatic/ad network, and Programmatic direct.
- When analyzing a single domain, this widget includes a chart on the left, breaking down the Impressions, Share of Voice, and Spending for each buying method.
- On the right is a pie chart that depicts the share of voice for each method.
- In Comparison Mode, this widget is instead a bar graph, depicting the share of voice by buying method for each compared domain.
Channels Distribution:
- Available only in Comparison Mode, the Channels Distribution breaks down the distribution of display, video, and social ads for each compared domain.
Tips and tricks for maximizing the effectiveness of AdClarity – Advertising Intelligence
Here are some tips and tricks for maximizing the effectiveness of AdClarity in uncovering competitor’s advertising strategies:
- Use the comparison mode to analyze multiple competitors at once and gain a better understanding of the broader advertising landscape.
- Utilize the various widgets available in AdClarity to gain deeper insights into your competitor’s advertising strategies, such as the ad placement widget, top ads widget, and estimated expenditure widget.
- Experiment with different filters and search criteria to get the most relevant and useful data for your analysis.
- Use the export feature to download reports and share data with your team or stakeholders.
- Keep an eye on emerging trends and new opportunities by using AdClarity to conduct market research and stay ahead of the curve.
By following these tips and tricks, you can use AdClarity to its full potential.
How to analyze the data obtained through AdClarity – Advertising Intelligence?
To analyze data obtained through AdClarity – Advertising Intelligence, you can follow these steps:
- Data Collection: Access the AdClarity platform and retrieve the relevant data for analysis. This may include information on ad campaigns, advertising placements, keywords, creatives, and audience targeting.
- Data Cleaning: Review the data and perform necessary cleaning tasks to remove any duplicates or errors. Ensure data is in a structured format suitable for analysis.
- Define Objectives: Clearly define your objectives for analysis. This could be evaluating the effectiveness of a specific ad campaign, identifying top-performing placements, or studying market trends.
- Key Metrics: Identify the key metrics that align with your objectives. These metrics could include impressions, click-through rates (CTR), conversion rates, ad spending, engagement metrics, or any relevant custom metrics.
- Performance Analysis: Analyze the performance of different ad campaigns, placements, or keywords based on the key metrics defined earlier. Compare and contrast their performance to find top performers or areas that need improvement.
- Competitive Analysis: Use AdClarity’s competitive intelligence data to compare your advertising performance against competitors. Identify their strategies, traffic sources, or ad placements that might be relevant to your objectives.
- Insights and Recommendations: Draw actionable insights from the analysis and make recommendations based on the findings. This could involve optimizing ad spend, refining targeting strategies, or adapting creatives for better performance.
Examples of how to use this information to improve your own advertising strategies
Here are some examples of how to use the information from AdClarity – Advertising Intelligence to improve your advertising strategies:
- Use the competitive analysis to identify which ad networks and publishers your competitors are using. You can then use this information to optimize your own advertising strategy and find new opportunities for reaching your target audience.
- Analyze your competitors’ ad copy and creative to see what messaging and imagery is resonating with their audience. Use this information to craft more effective ad copy and creative for your own campaigns.
- Use the ad comparison feature to analyze and compare your ads to those of your competitors. This can help you identify areas where your ads are falling short and make adjustments to improve their performance.
- Utilize the estimated expenditure widget to gain insights into how much your competitors are spending on their advertising campaigns. This can help you determine if you need to adjust your own ad spend to stay competitive.
FAQ
What is Semrush App Center?
Semrush is a digital marketing tool that enhances online visibility and audience reach. It has a user-friendly app store named Semrush App Center.
The Semrush App Center is a marketplace featuring apps hand-picked by Semrush. These apps are designed to fulfill the needs of digital marketers, such as optimization of stores, intelligent advertising, and content creation.
Here are the most popular apps in the Semrush App Center:
AdClarity: An advertising Intelligence app that provides a comprehensive analysis of the display, social, and video advertising campaigns and performance of your competitors.
ContentShake: AI content writing tool that helps with creating high-quality and SEO-optimized content.
Influencer Analytics: An all-in-one influencer marketing tool that enables you to manage every stage of an influencer marketing campaign in one location.
Who can use the AdClarity – Advertising Intelligence App?
AdClarity – Advertising Intelligence App provides valuable insights for creating successful digital advertising campaigns, catering to Advertisers, Agencies, Publishers, and Ad Networks.
Conclusion
in conclusion, AdClarity – Advertising Intelligence is a powerful tool that can provide valuable insights into your competitor’s advertising strategies.
By using AdClarity, you can gain a comprehensive understanding of your competitors’ target audience, messaging, and ad placement. With this information, you can optimize your advertising strategy and stay ahead of the game.

